game sales analysis
Posted on January 1, 2022 • 1 minutes • 205 words
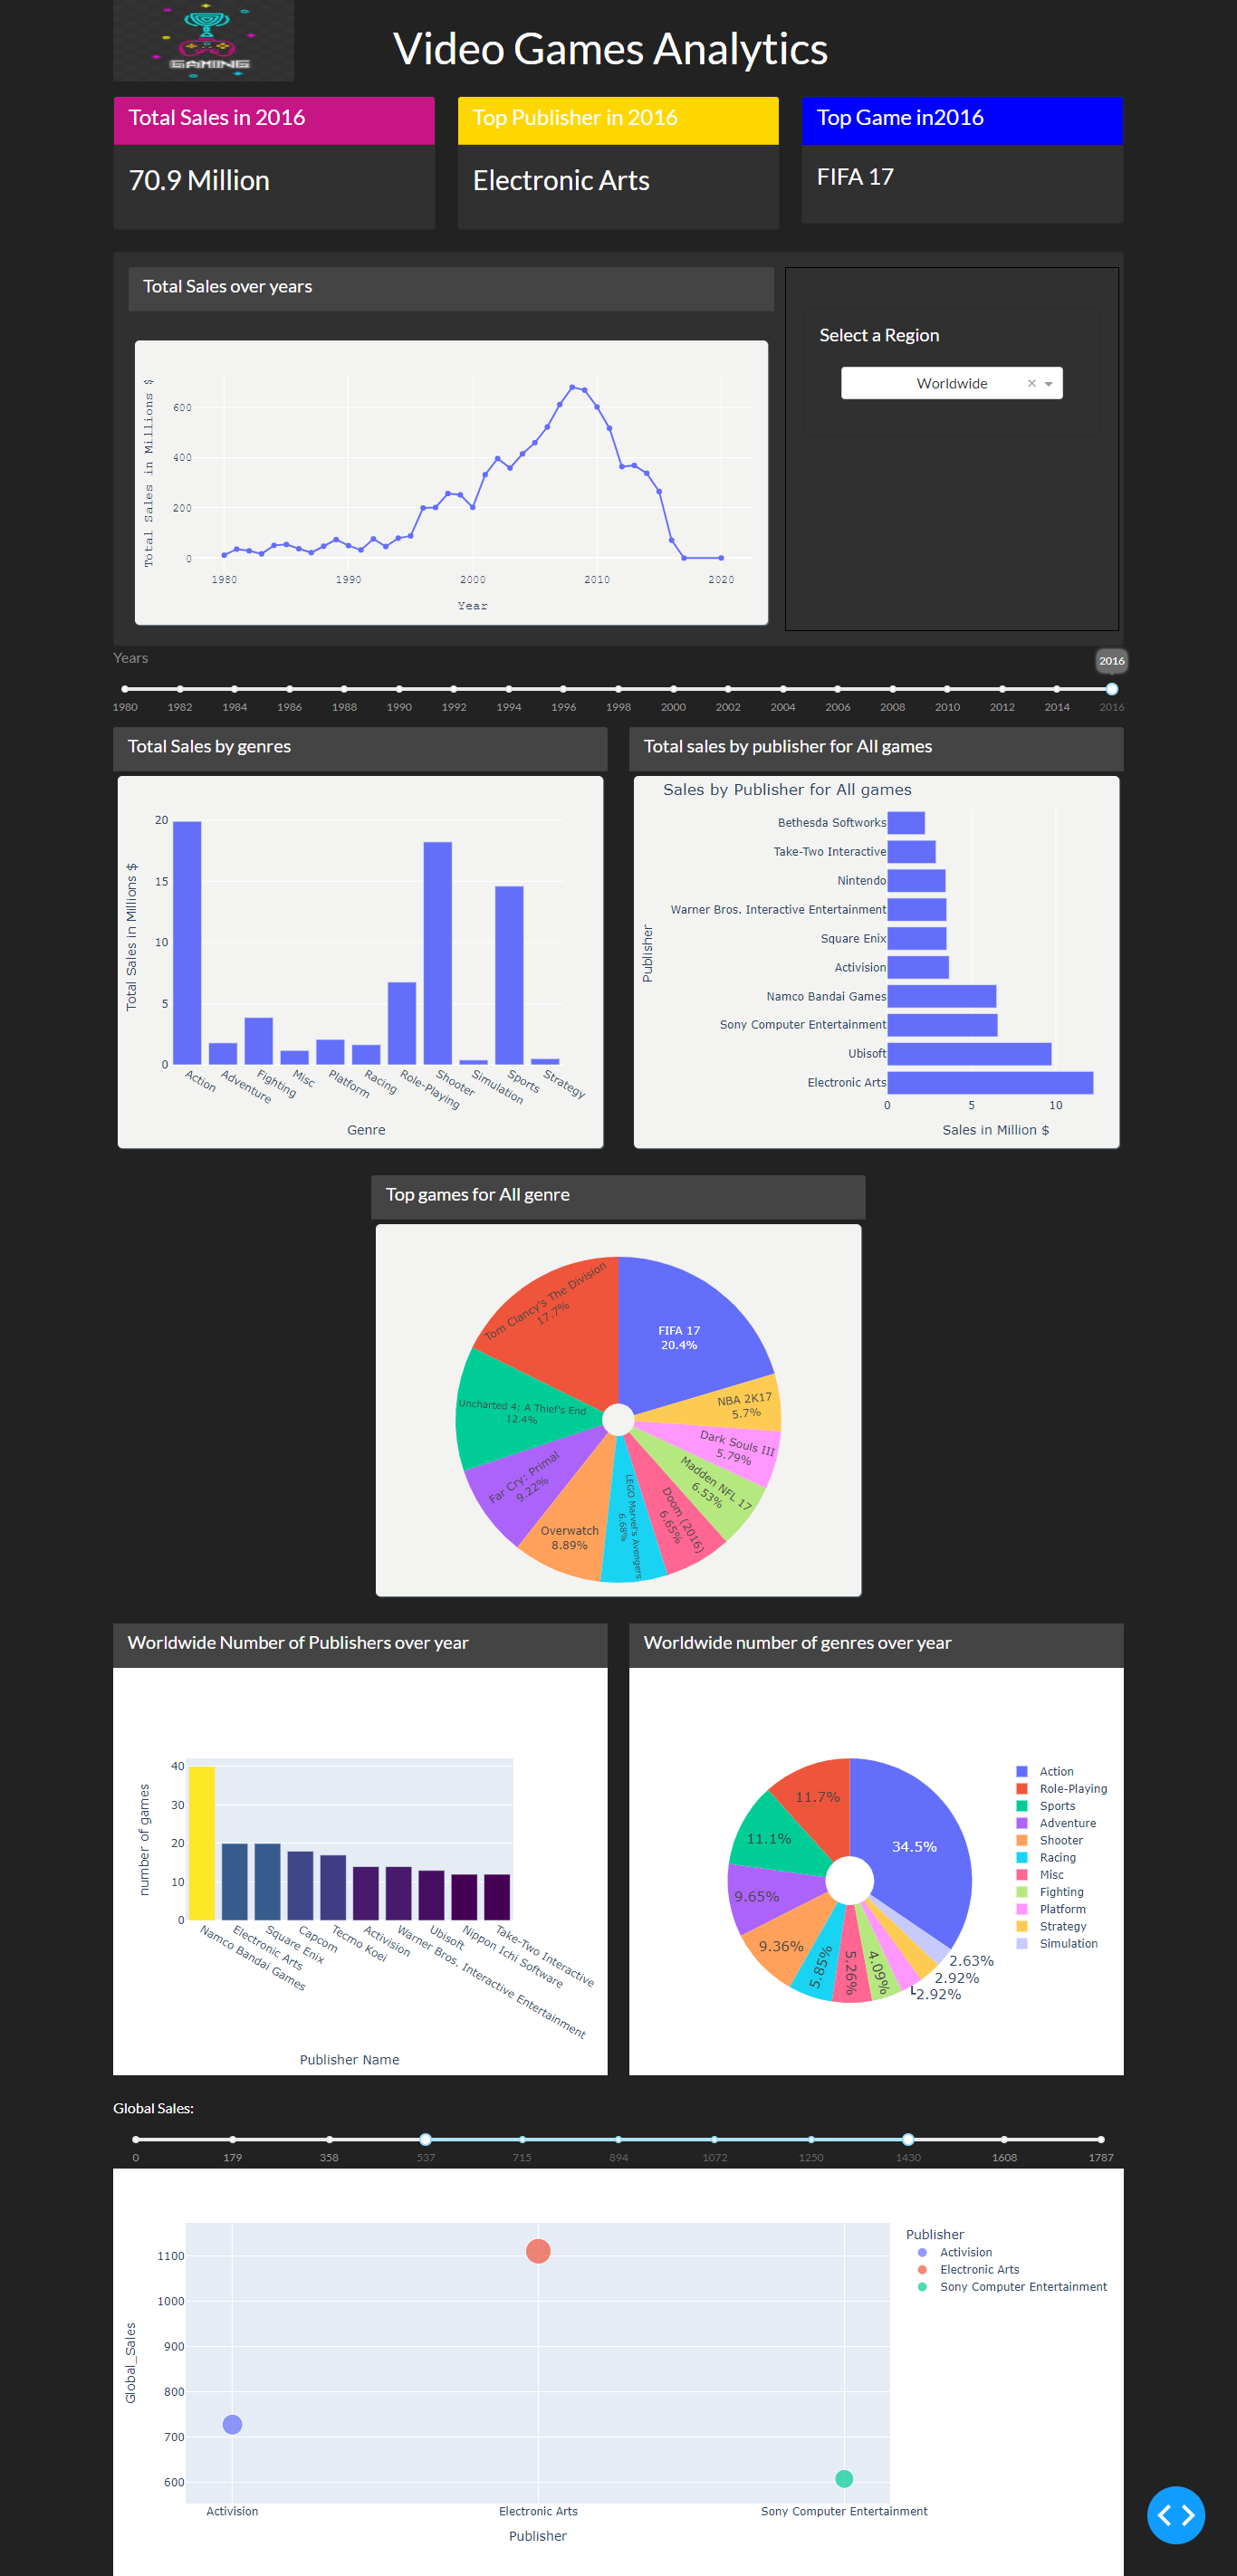
project where I used the Plotly library to create a dashboard for analyzing video game sales data.
The dashboard was built using Plotly’s Dash framework, which allowed me to create a web-based interface for exploring and visualizing the data.
The dataset I used contained information on video game sales across multiple platforms and regions. I used Plotly’s interactive charting tools to create visualizations of the data, including line charts, scatter plots, and bar charts. These charts allowed me to explore trends in the data and identify patterns in the sales figures.
In addition to the visualizations, I also created a number of interactive controls on the dashboard. These included dropdown menus for selecting specific platforms and regions, sliders for filtering the data by year, and buttons for toggling between different chart types. This allowed users to explore the data in a variety of ways and gain deeper insights into the video game sales market.
Overall, the project was a great opportunity to explore the capabilities of Plotly and Dash, and to apply my data analysis skills to a real-world dataset. I’m excited to continue working with these tools in the future and building more interactive dashboards for data analysis.